Calculating the Engineering Cost of Manual QA at Scale
Hidden costs of manual QA multiply across hiring, engineering capacity, and escaped defects.
Manual QA at scale has a business cost that extends well beyond tester salaries. The costs of loaded headcount, hiring delays, lost engineering capacity, and escaped defects build on each other as teams produce more software. Teams need to build a verification architecture that can keep pace without proportional growth in human effort.
Why QA cost looks like a staffing number but behaves like a structural tax
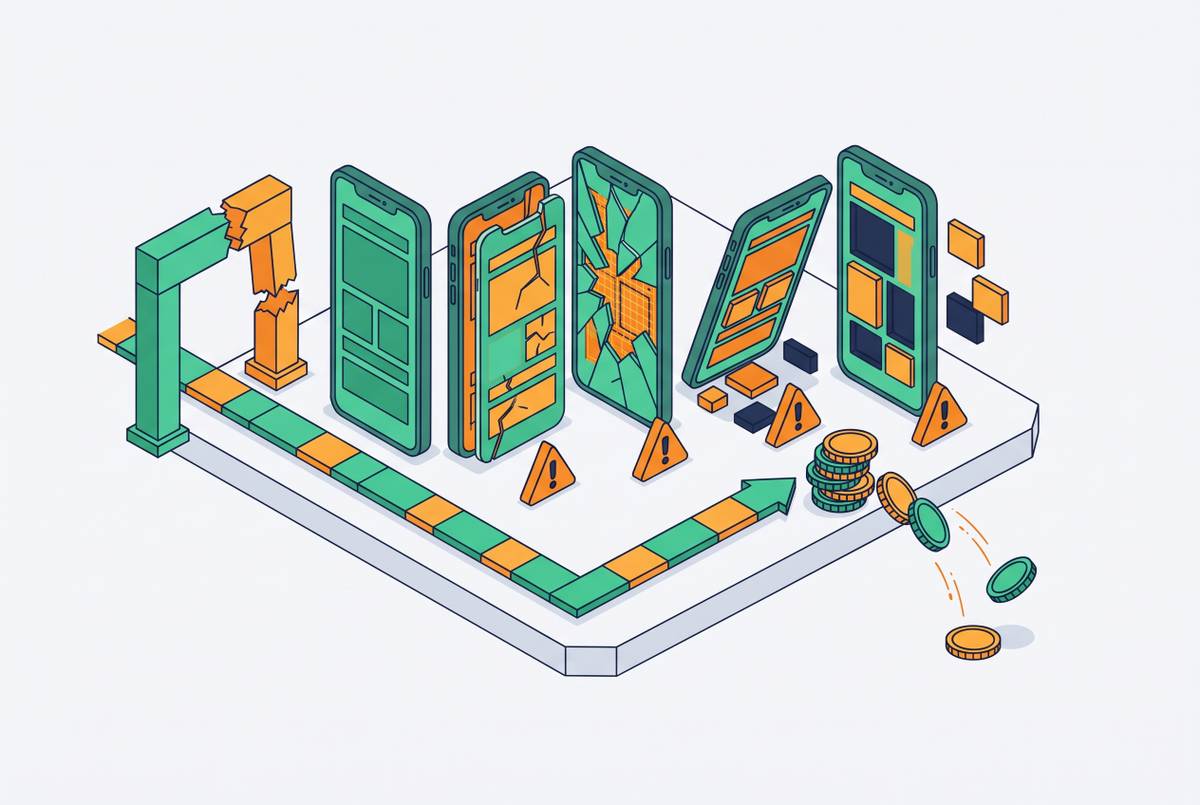
A QA budget usually covers the costs that are easy to see, including salaries, tool subscriptions, and recruiting fees. Those expenses belong to a function with a clear owner. The costs that are harder to see fall elsewhere in the organization, where developers take on verification work, releases wait for regression testing, and support teams handle defects that reach users. The budget boundary obscures the operational cost. As a result, a staffing decision can look affordable within QA while imposing a recurring tax on engineering capacity and delivery.
That mismatch also changes how leaders interpret pressure. A growing test backlog appears to call for another hire, while slower releases appear to be a delivery problem. Yet both can follow from the same constraint in verification capacity. The distinction is not merely an accounting issue. A model that excludes these connections cannot show whether another hire will resolve the constraint or just move it.
The loaded cost of a single QA hire, before they test anything
Base salary is the starting point. A mid-level manual QA role commands a base salary in the high five figures, before benefits, recruiting, onboarding, and tooling enter the calculation. Those additions push the first-year cost of an in-house hire well into six figures before any downstream delivery effects are included. Comparing staffing options on salary alone therefore compares only part of their cost.
Skill requirements widen that difference further. Automation QA commands a premium over manual testing because the role requires coding skill. Security testing costs still more because fewer people have the skills and more is at stake when it fails. Roles that focus on automation also have a higher fully loaded cost. Their compensation competes more closely with mid-level software development roles than a manual-testing budget might suggest.
Geography can move the price substantially for comparable skills, which explains the appeal of geographic arbitrage in QA budgeting. Outsourcing can also reduce all-in cost relative to an in-house hire. With either approach, the skills needed to deliver the software stay the same. Teams that need to keep pace with CI/CD pipelines need automation engineers as well as manual testers. Their cost baseline must reflect that distinction before leaders assess how much verification capacity they can afford.
What the hiring timeline costs before the new QA engineer runs a single test
General QA and test engineering roles can take weeks to fill, while senior automation roles take longer because they compete with software development positions. Filling the vacancy is only one milestone. A typical three-to-six-month hiring cycle leaves a period in which the team needs coverage that the incoming engineer cannot yet provide. During that gap, the existing engineering organization absorbs the shortfall.
Developers respond by reducing feature work, writing more defensive code, spending more time on manual verification, and declining risky features. This is rational behavior when coverage is missing. It keeps the release safe at the cost of producing less software, but that cost rarely appears alongside the open QA requisition. The staffing gap therefore has a cost even when the role remains unfilled and no salary is being paid. Waiting is not financially neutral for the team.
Islands, a fractional CTO service that manages several client projects at once, shows the kind of setting where this pressure is especially strong. In that setting, missing coverage can affect delivery commitments across projects. The mechanism does not require a failed release to become expensive. Time diverted into self-verification is already time unavailable for feature work. The cost of a QA hiring decision starts accumulating while the need remains unmet, before an offer is signed.
How developer context switching turns QA bottlenecks into an engineering capacity problem
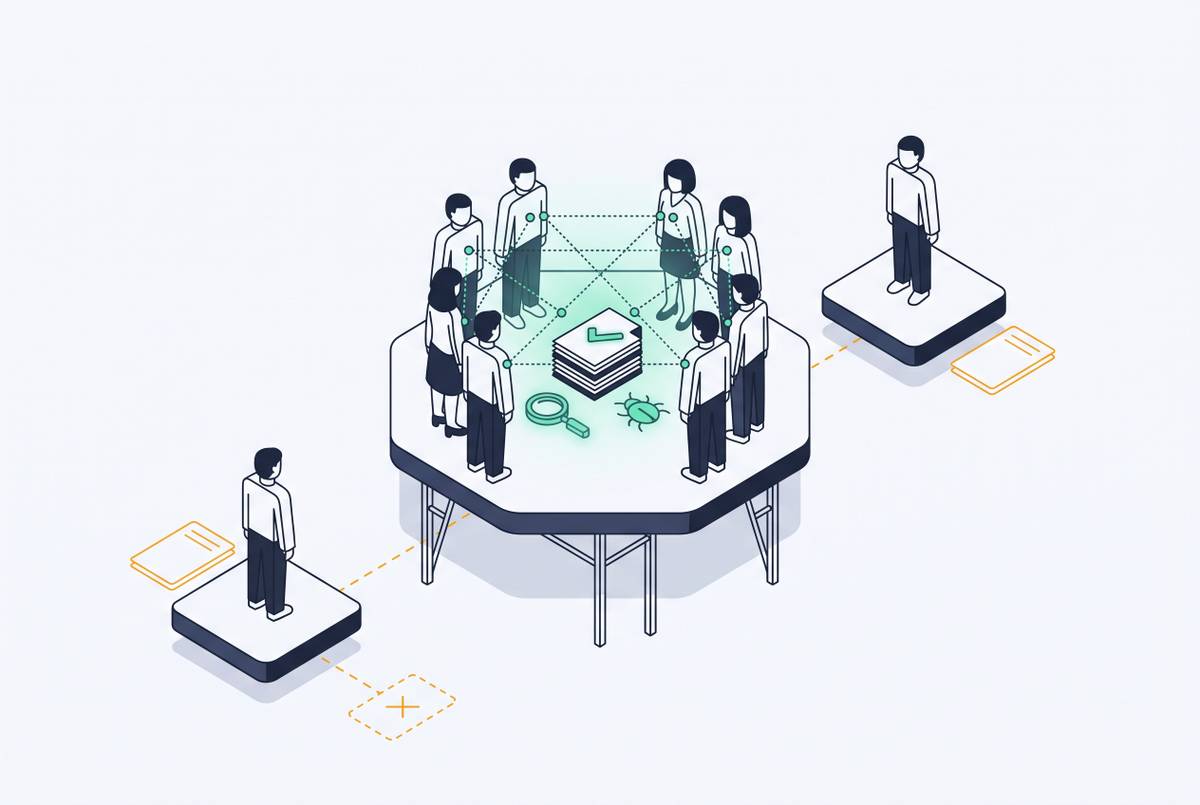
An understaffed QA function does not leave all its work undone. Developers take on the overflow instead. That shift makes the QA budget look smaller, but the work of verifying the software still needs to be done. It also puts the work inside a more fragmented cycle, as engineers move between feature development, investigation, and release support. The expense relocates into engineering capacity, where it is less likely to be identified as a QA cost.
A reported bug requires more than the code change that fixes it. The developer must reproduce the issue, return to the relevant code context, make the correction, verify it, and update related tests. The work around the fix can take several hours per bug on top of the fix itself. At scale, those repeated interruptions absorb a meaningful share of developer capacity. Measuring only repair time misses the investigation and context recovery that make the repair possible.
Flaky tests and CI failures also pull developers away from their work. A developer who cannot merge because a suite is red may spend an hour rerunning pipelines for a failure unrelated to the proposed change. That hour is a verification expense, even though engineering pays for it. QA spending stays within budget while the engineering team gets less done with the time already paid for.
The linear scaling trap: why adding QA headcount cannot solve a math problem
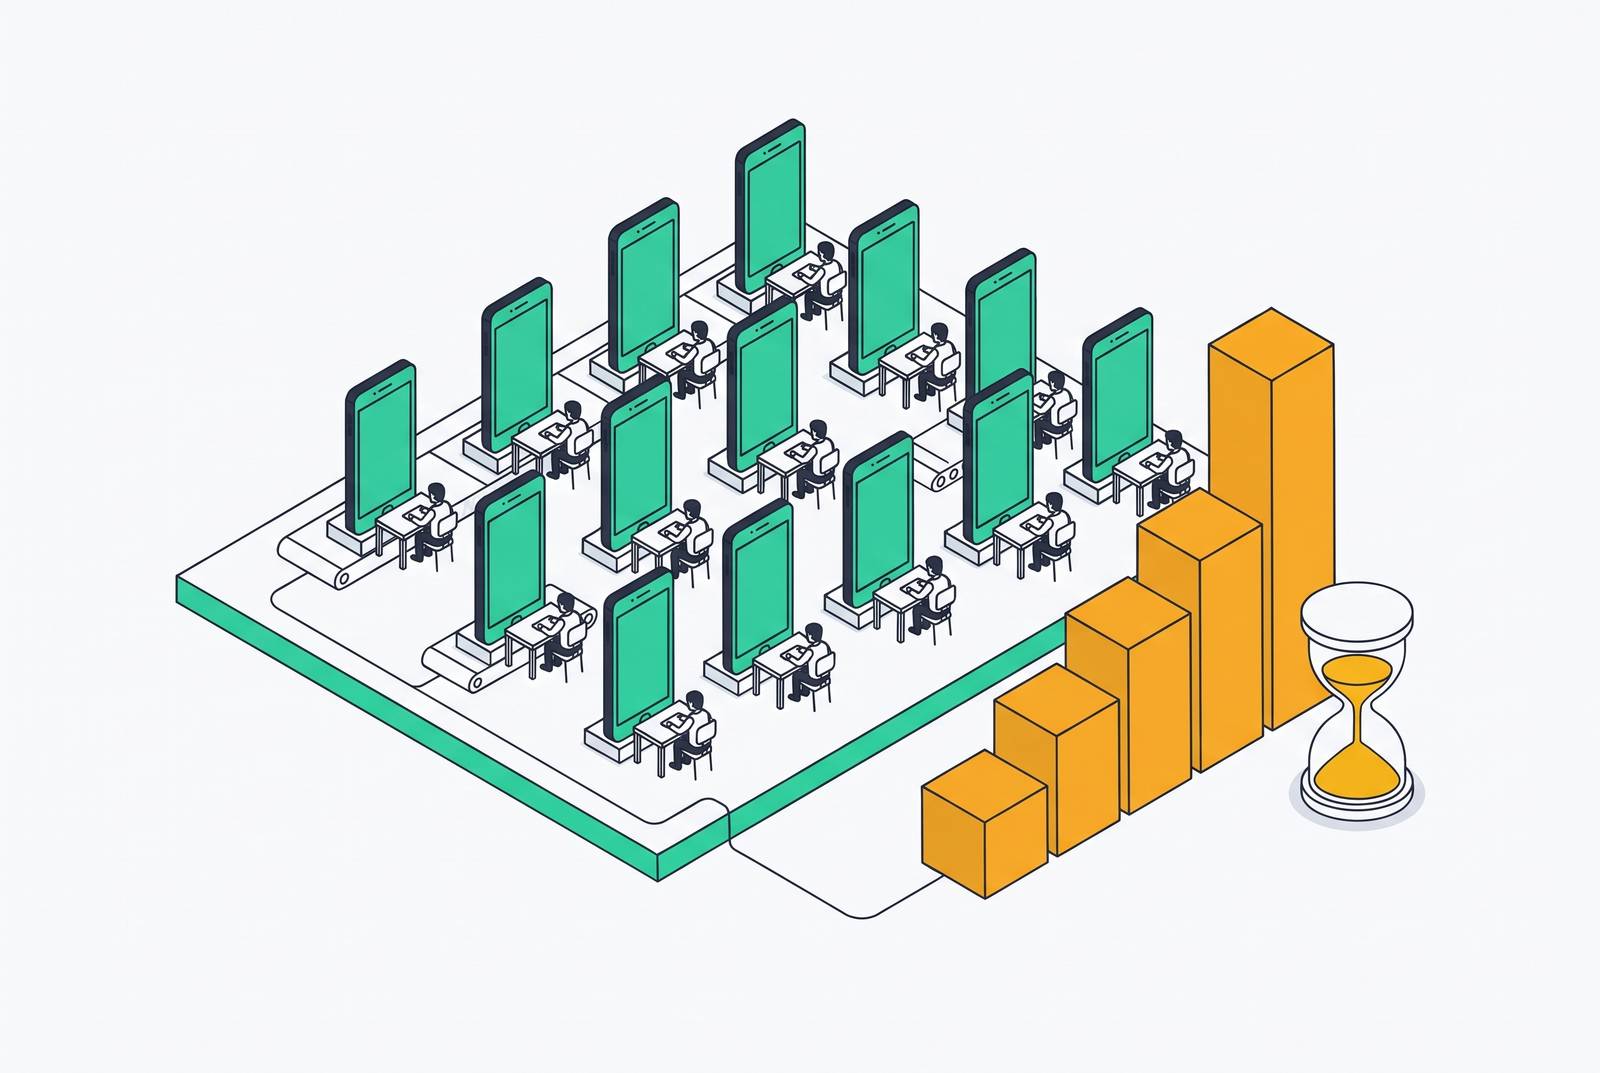
Standard QA-to-developer ratios run roughly from one QA engineer for every three developers to one for every five, with many teams near one for every three or four. This creates a proportional staffing requirement. As an engineering organization grows from mid-sized to large, its QA function must grow with it, but each hire can take three to six months to become productive. If the team keeps hiring developers during that time, it needs more coverage before the new QA hire can help. The hiring process is chasing a changing denominator.
A multi-day regression cycle establishes a minimum release cadence that more headcount alone cannot compress. The limiting factor is how testing is organized. Adding people to the same verification architecture does not remove its cycle-time floor, even if it expands the amount of work the team can handle. Reducing that delay requires changing how testing is done.
Feature output can multiply without a corresponding increase in the number of developers, so developer headcount becomes a weaker proxy for verification demand. Human QA teams cannot plausibly expand at the rate agents can produce code. Agents can mark features complete when unit tests pass even if those features fail in actual end-to-end use, so QA still has to check that they behave as the requirements say they should.
Automated testing frameworks reduce execution time but leave test creation and maintenance as manual work. The bottleneck shifts into authoring and upkeep. Outsourcing changes the labor model, yet asynchronous decisions and communication delays can lengthen regression cycles. Follow-the-sun overnight testing can instead compress them, which shows how the operating design shapes the result.
What defects that escape QA actually cost, and why the late-stage multiplier matters
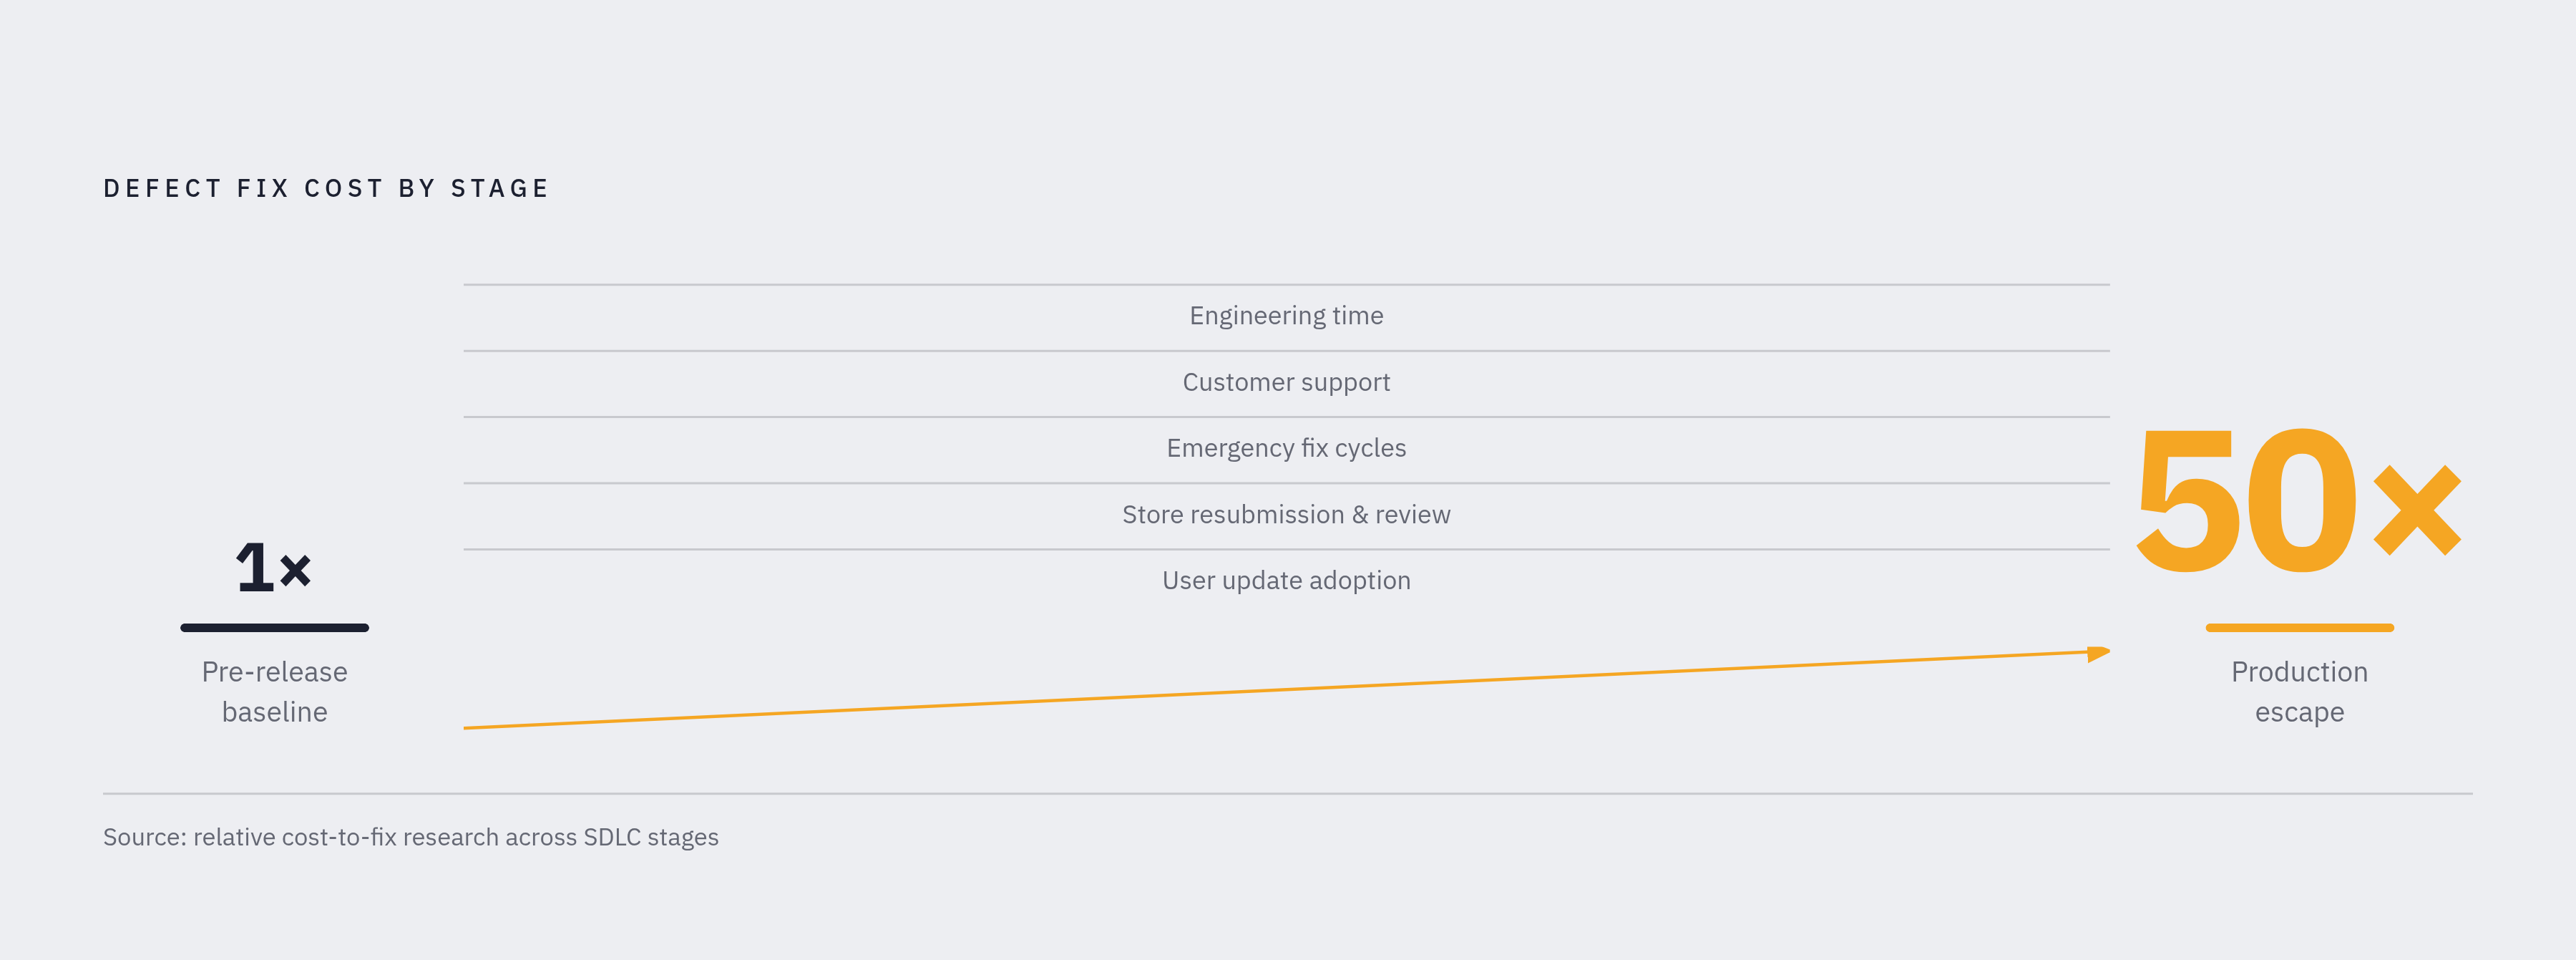
Verification shortfalls create risk as well as delay. A defect caught in production can cost 50 times more to fix than one caught before release. That differential makes defect escape rate a central part of the investment calculation. Even a small improvement can justify substantial QA spending when it prevents expensive production failures. A comparison limited to tester compensation omits the cost of the failures that additional verification could prevent.
The production repair is only part of that expense. Incidents also need customer support and emergency fix cycles, and they pull engineers away from planned work. Teams shipping bi-weekly with insufficient coverage can accumulate those burdens across a quarter. The disruption does not stay within the release that introduced the defect. Emergency response keeps taking time that the delivery plan had set aside for other work.
Mobile applications make recovery more difficult still. A production defect cannot simply be patched silently, because the correction requires a store submission, a review cycle, and user update adoption. Store rejection adds a separate delay and cost. A significant share of Apple App Store submissions are rejected, with performance problems including crashes, bugs, and incomplete builds forming the largest rejection category by volume.
AI-generated code has a higher defect rate than human-written code, so teams that adopt coding agents without improving verification face more risk. When defects reach users, customer churn also turns a quality failure into a revenue-retention cost. Hiring lag, developer interruptions, scaling gaps, and late-stage repair costs are therefore not separate staffing complaints. They expose the consequences of treating QA as a labor function.
Building the full cost model: what engineering leaders need to measure before deciding how to scale
To make a defensible scaling decision, engineering leaders need to measure loaded headcount, bottleneck drag, and defect escape costs together. The first calculation starts with every current and projected QA hire. Apply the 1.25–1.4× multiplier to base salary. Account for the manual-versus-automation split because CI/CD requirements change the skills and compensation needed. Include time-to-fill as a period of lost engineering productivity.
Estimate weekly developer hours spent investigating and reproducing bugs and triaging CI failures, then multiply those hours by the loaded developer hourly rate. Regression delays need a separate measurement. Record the cycle length and estimate what each additional day costs in delayed feature delivery. Assess the QA-to-developer ratio against projected growth and actual hiring timelines to establish whether coverage can keep pace or whether the shortfall is already expanding.
Estimate the current production escape rate and the average cost of resolution, including engineering time, support overhead, and emergency fixes. Mobile teams also need to account for store resubmission, rejection risk, and the user-rating impact of quality regressions. Retention belongs in the model as well. Even a directional estimate of customer loss connects quality decisions to the business consequences that a QA budget leaves out.
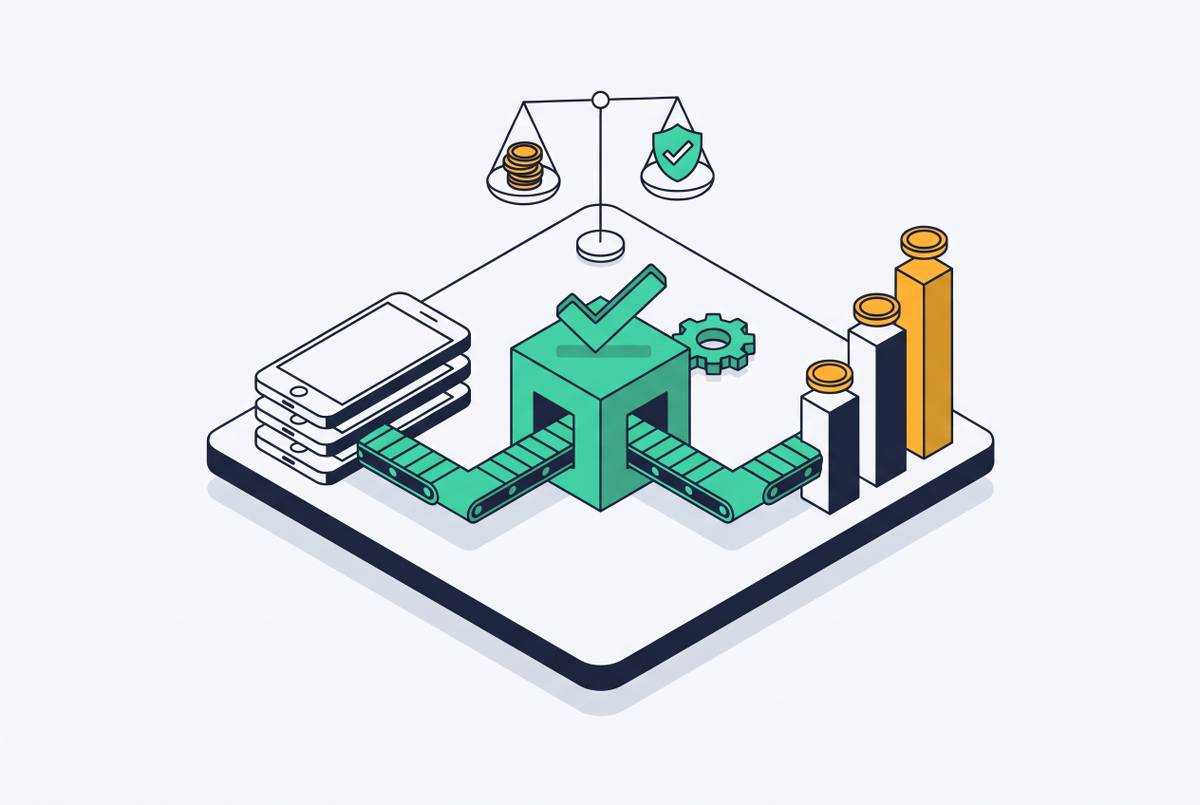
With those categories combined, leaders can assess proposed capacity against the costs it would actually reduce. A cheaper hire may lower labor expense without shortening regression, while faster test execution may leave manual authoring as the constraint. The verification architecture must enforce quality standards at the speed agents generate code without proportional growth in human verification effort. AI-powered verification platforms use a team's quality expectations to generate coverage and keep it up to date, and to enforce standards across builds and proposed code changes. Their relevant distinction is not faster test execution alone, but less manual work in test creation, standard enforcement, and release gating.